Overview
Most teams do not measure lead time and cycle time [1], missing opportunities to improve their system’s value flow. Here’s an example of how a data center team I worked with managed to reduce their cycle time from 32 days to 5 days by starting to measure it.
Initial Setup and Discovery
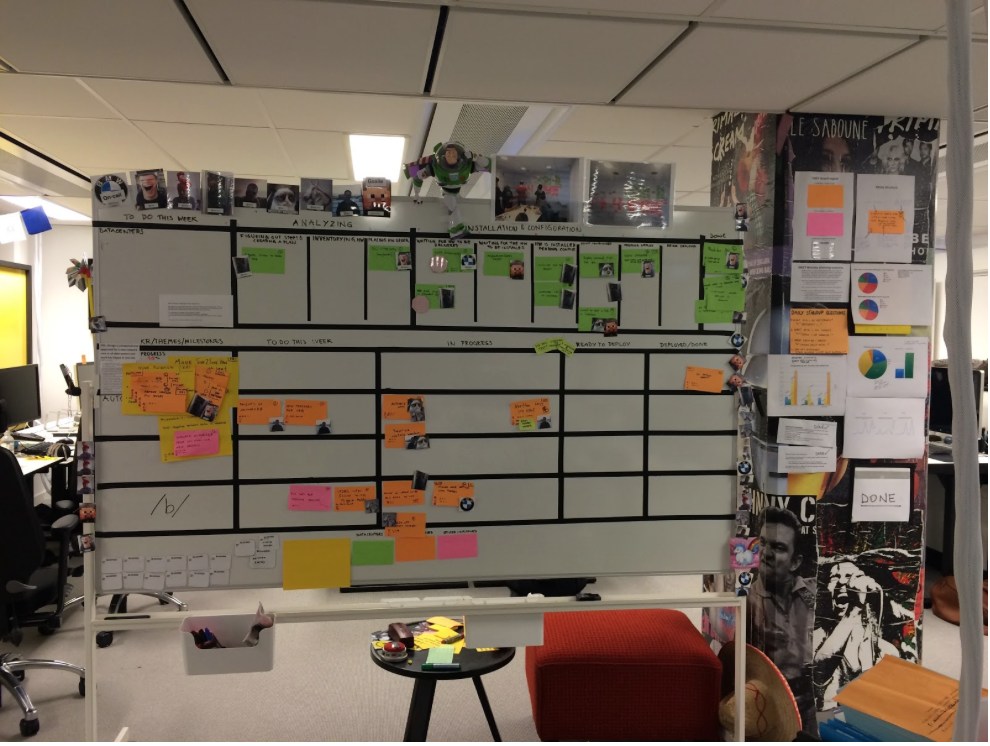
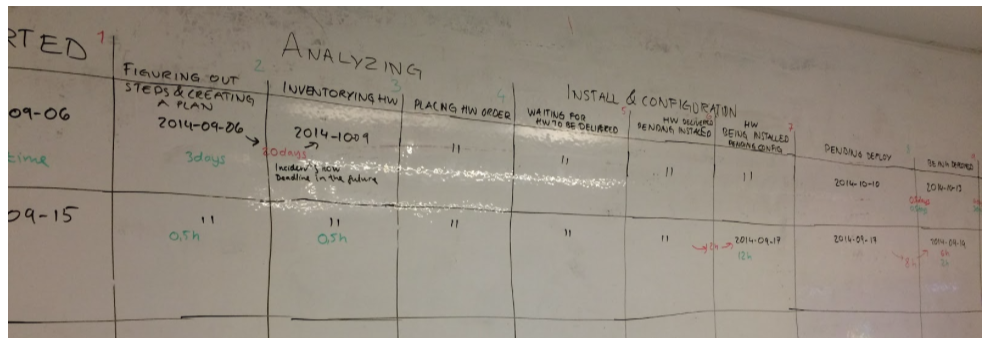
We visualized our work on a physical board and tracked our metrics manually because the available tools (Jira, Trello, LeanKit Kanban) did not meet our specific needs. We did not know what we would discover, but once we measured our metrics, we learned that our cycle time was significantly higher whenever work involved scaling a part of our data centers. (Physical board + manual excel ftw!)
Investigating the Process
To understand why, we recorded how much time these tickets spent in different states from start to finish[2], identifying whether the time was value-adding or wasteful. We color-coded value-adding states green and waste states red. Value-adding activities included deploying new machines on the network, assigning IP addresses, and restarting routers. Examples of waste included waiting for someone to review changes, waiting for hardware to be delivered, and waiting for hardware to be installed.
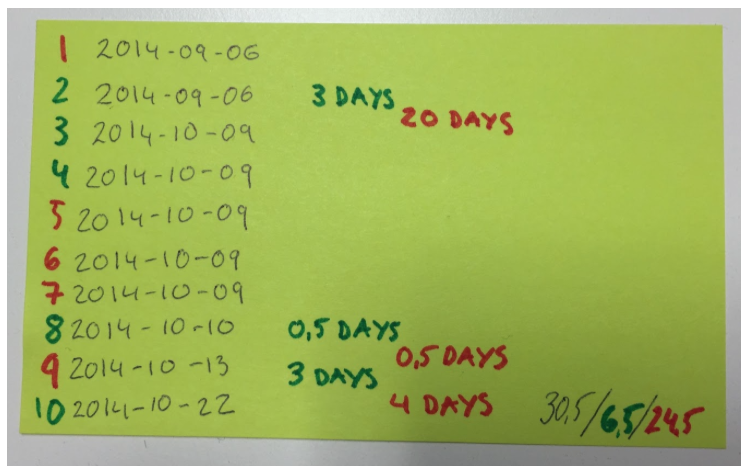
Whenever we made progress we would note down the date, and how much time we’d spent on the ticket, on the backside of the sticky.
Identifying and Addressing the Root Cause
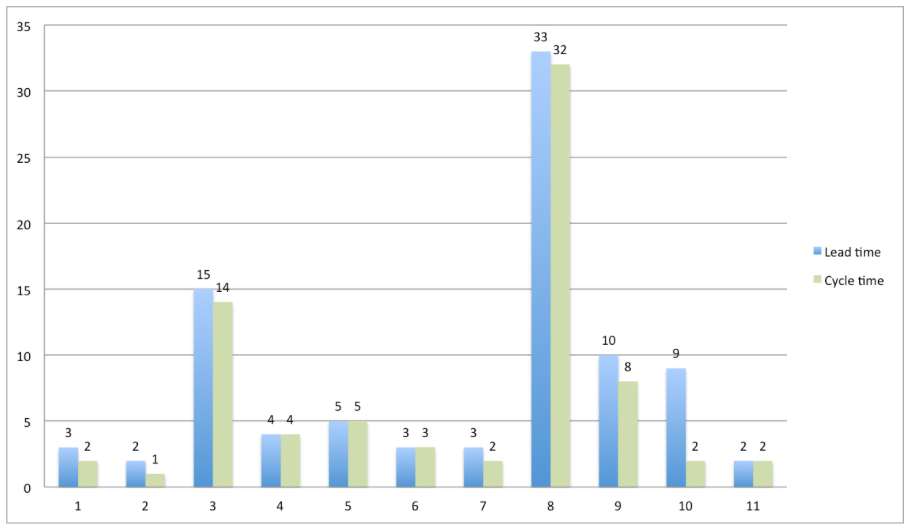
We discovered that a lack of specific hardware in our inventory affected our cycle time, increasing it to over 30 days when specific hardware were out of stock, leading to 80% wait time (waste). When the hardware were in stock, the cycle time was reduced to 5 days. Knowing how many requests we received per month allowed us to evaluate how large our hardware inventory needed to be to consistently achieve a 5-day cycle time. This was done in collaboration with our procurement team, considering financial and risk perspectives.
Recommendations for Implementation
- Visualize Your Workflow: Make it more granular than traditional “To Do”, “In Progress”, and “Done”. We identified 11 states in our workflow.

- Track Progress Manually: Note timings and dates on the backside of stickies. It’s hard to remember details after 2+ weeks.

- Conduct Focused Retrospectives: In your analysis meetings, draw the workflow on the board and ask, “What’s working well?”, “What’s slowing us down?”, and “What can we do to reduce waste?”

Conclusion and Encouragement
Measuring and analyzing lead time and cycle time can lead to significant improvements in your operations. If you decide to try this out, please reach out and share your stories. I’d love to hear them!
Thanks for reading and good luck!
[1] Lead time = time from when an idea is generated until it’s in production. Cycle time = time from when work is started until it’s finished. In our case – when it’s in production.
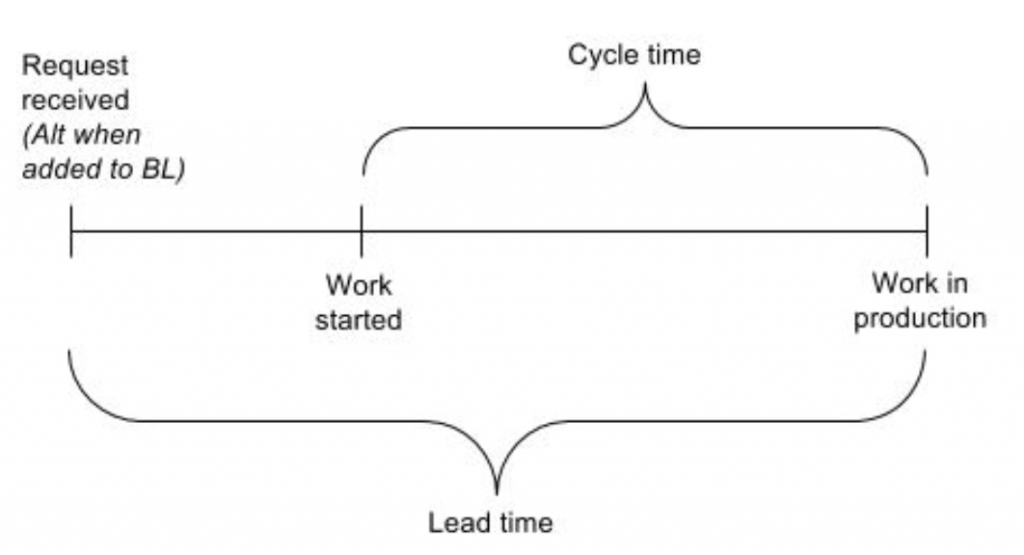
I should point out that there are different definitions of LT and CT. For example in lean manufacturing it means something different than it does in lean software development. And even agile teams use it differently. Some teams have defined cycle time as the time from when they commit on work until when it’s in production. Other teams define cycle time as the time between when they start working on something until when they send it to their ops team for deployment, or until when they submit an app to appstore. What’s important is to identify and agree what makes sense for you, and to then measure that.
[2] Here are the states we had:
- Not started
- Figure out steps + create a plan
- Inventory Hardware (HW)
- Place Hardware order
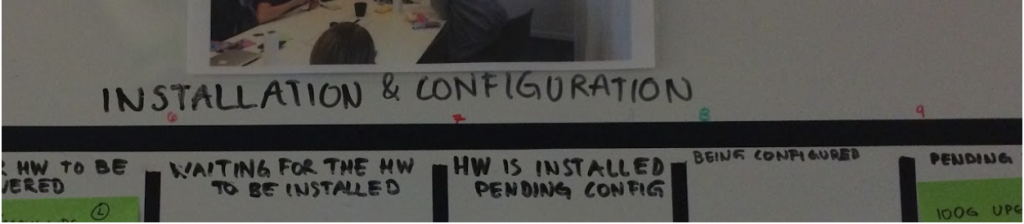
- Waiting for HW to be delivered
- HW delivered, waiting to be installed
- HW is installed pending configuration
- HW is being configured
- Pending Deploy
- Being deployed
- Done
One Comment
Bouke Bergsma
Very very nice article. Also, very nice Excel sheet, thanks for providing that for free. It was exactly what I was looking for in my search to quickly calculate some LT/CT metrics in our small team with low story volume (maybe 20-30 a month)…
Thanks also for all your pointers, even years later you added value to our workflow by your sharing.
What I wanted to specifically compliment is your term “Examples of *value adding activities*” as this is exactly what it should all be about. Nice way to put it!
Keep up the good work.